Acceleration
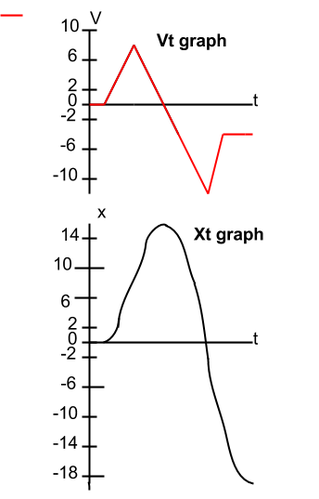
Part 1. To find out the instantaneous velocity at 8 seconds i would look at the Vt graph and find where the line is at that point, which right at 8 seconds is -12 m/s. And to find the total distance that the object travels you must find the area of the shapes in the lines. This area would be the area of one triangle plus the area of another triangle plus the area of a trapazoid. So, d=area of 1tri.+area of 2tri.+area of trap. and looking at the graph for the first triangle you see that the base is 4 units across and is 8 units high, so A(for area)=(1/2)(4)(8)= 16m, then for the second triangle you see the base in 3 units across and also 8 units down, so A=(1/2)(3)(8)=12m, then finally for the trapazoid, you see the top base is 6 units across, and the bottom is 5 units, but the height is 4 units. So, A=(1/2)(6+5)4)=22m. Then add them all together, 16m+12m+22m=50m. So that means the object traveled 50m.
Rise over run-For the first segment: 4/1=4m/s^2. This means the object is traveling an additional 4 meters per second. The slope of the velocity determinds the acceleration.
I found the displacement at each second for the xt graph by calculating each second's area on the Vt graph, and added them together consecutively, depending on direction. the curving slope that is getting steeper shows that the object is speeding up, while the curving slope that is getting less steep shows that the object is slowing down.

I plotted the points at each corresponding seconds, which I found from the xt graph for my position graph. The arrows moving to the right(1-5seconds) show it's moving forward, and the arrows moving to the left(6-11seconds) shows it's moving backwards. When the dots are close together(4-5seconds) it represents the object slowing down. When the dots are wide apart(7-8seconds) it represents the object speeding up.
Part 2. You and your lab partner are doing a project on the roof when he steps off and falls to the ground at -10m/s to start with.

As the lab parter started to fall, he started off slower but gradually gained speed the longer he fell for.
This graph as the equation of y=(-4.9m/s^2)t^2-10m/st+120. The -4.9 represents acceleration divided by 2(m/s^2), t^2 stands for time squared, the -10 is the initial velocity given in the begining. and the 120 is the initial position(m)
This graph as the equation of y=(-4.9m/s^2)t^2-10m/st+120. The -4.9 represents acceleration divided by 2(m/s^2), t^2 stands for time squared, the -10 is the initial velocity given in the begining. and the 120 is the initial position(m)

The lab partner's velocity starts at -10m/s and his velocity is constantly increasing as he falls.
This graph's equation is V=(-9.8m/s^2)t-10, where V is the velocity, (-9.8m/s^2) is the aceleration of free falling, t is time, and the -10 is the initial velocity.
This graph's equation is V=(-9.8m/s^2)t-10, where V is the velocity, (-9.8m/s^2) is the aceleration of free falling, t is time, and the -10 is the initial velocity.

All things that a free falling have a constant acceleration of 9.8m/s^2
But, in
